Master Thesis of Timo Frielink
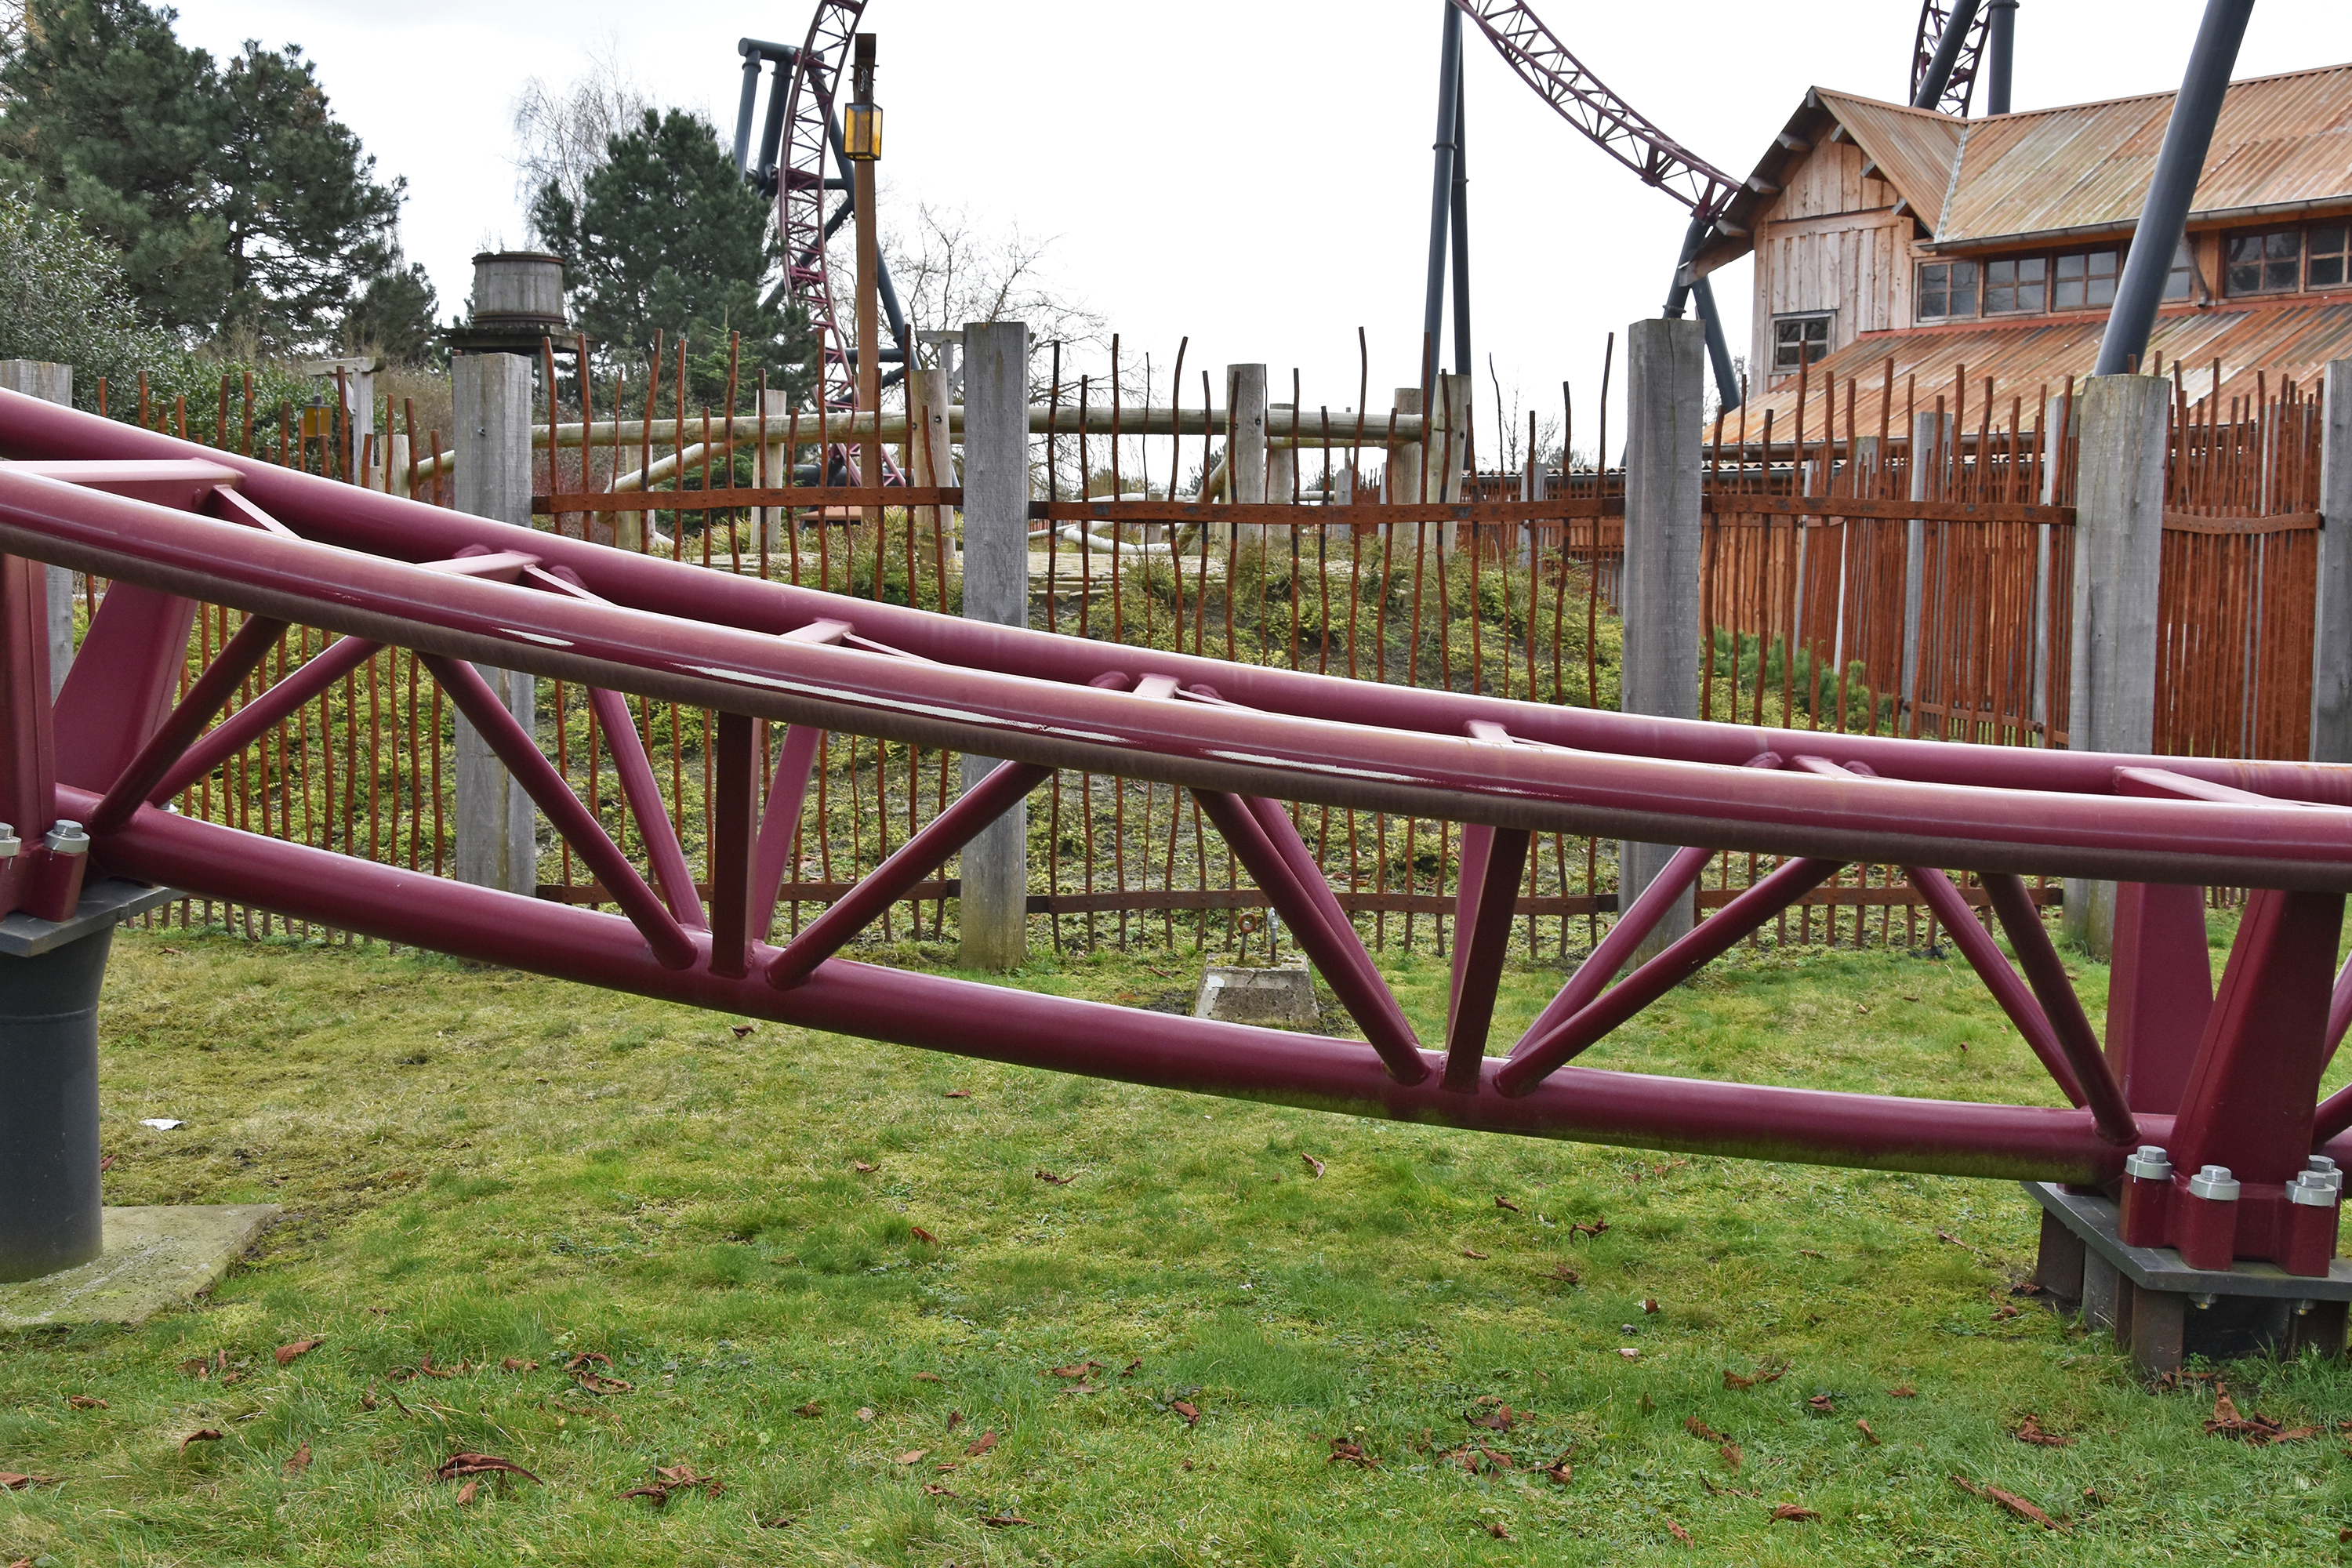
Steel roller coasters are iconic and complex structures in theme parks. Different structural designs exist for roller coasters, depending on the manufacturer or type of roller coaster. The two most common track designs for these thrill rides are the traditional backbone design, see Figure 1c, and the triangle track, see Figure 1a. It is unknown which track type is optimized best, regarding production costs. This graduation thesis focuses on which of these two track types is the optimal design based on production costs and if this design can be further optimized.
In the optimization process, different structural designs of tracks will be optimized for production costs. For the structural design, the support columns are not taken into account and will be modeled as supports. Every optimized structural design should fulfill the structural requirements according to the Eurocode. The differences in structural design are, for instance, the type of track (backbone- or triangle track) or type of truss (Pratt- or Warren truss). In the end, the optimized structures will be compared to each other. In this article, only the setup for the optimization, including the model, load cases, and boundary conditions, will be discussed since the optimization is not yet executed.
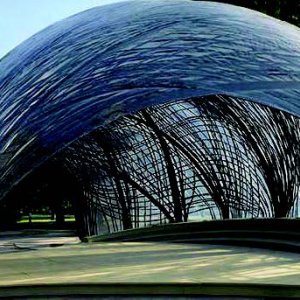
The two track designs for the optimization are the traditional backbone design (Figure 1c) and the triangle track (Figure 1a). In the traditional backbone design, the rails consist of two Circular Hollow Sections (CHS), which are connected to the main loadbearing element, called the backbone, with thin steel plates. The alternative, a triangle track, is a threedimensional truss where braces are used to connect the chords. To obtain realistic dimensions as a starting point for the optimization, I visited Theme Park & Resort Slagharen and Theme Park Toverland to measure the track dimensions of several roller coasters, such as the section dimensions and center-to-center distances between members. The roller coasters I measured were Gold Rush, Dwervelwind, and Booster Bike, see Figure 1.
a: Gold Rush (Theme park & Resort Slagharen)
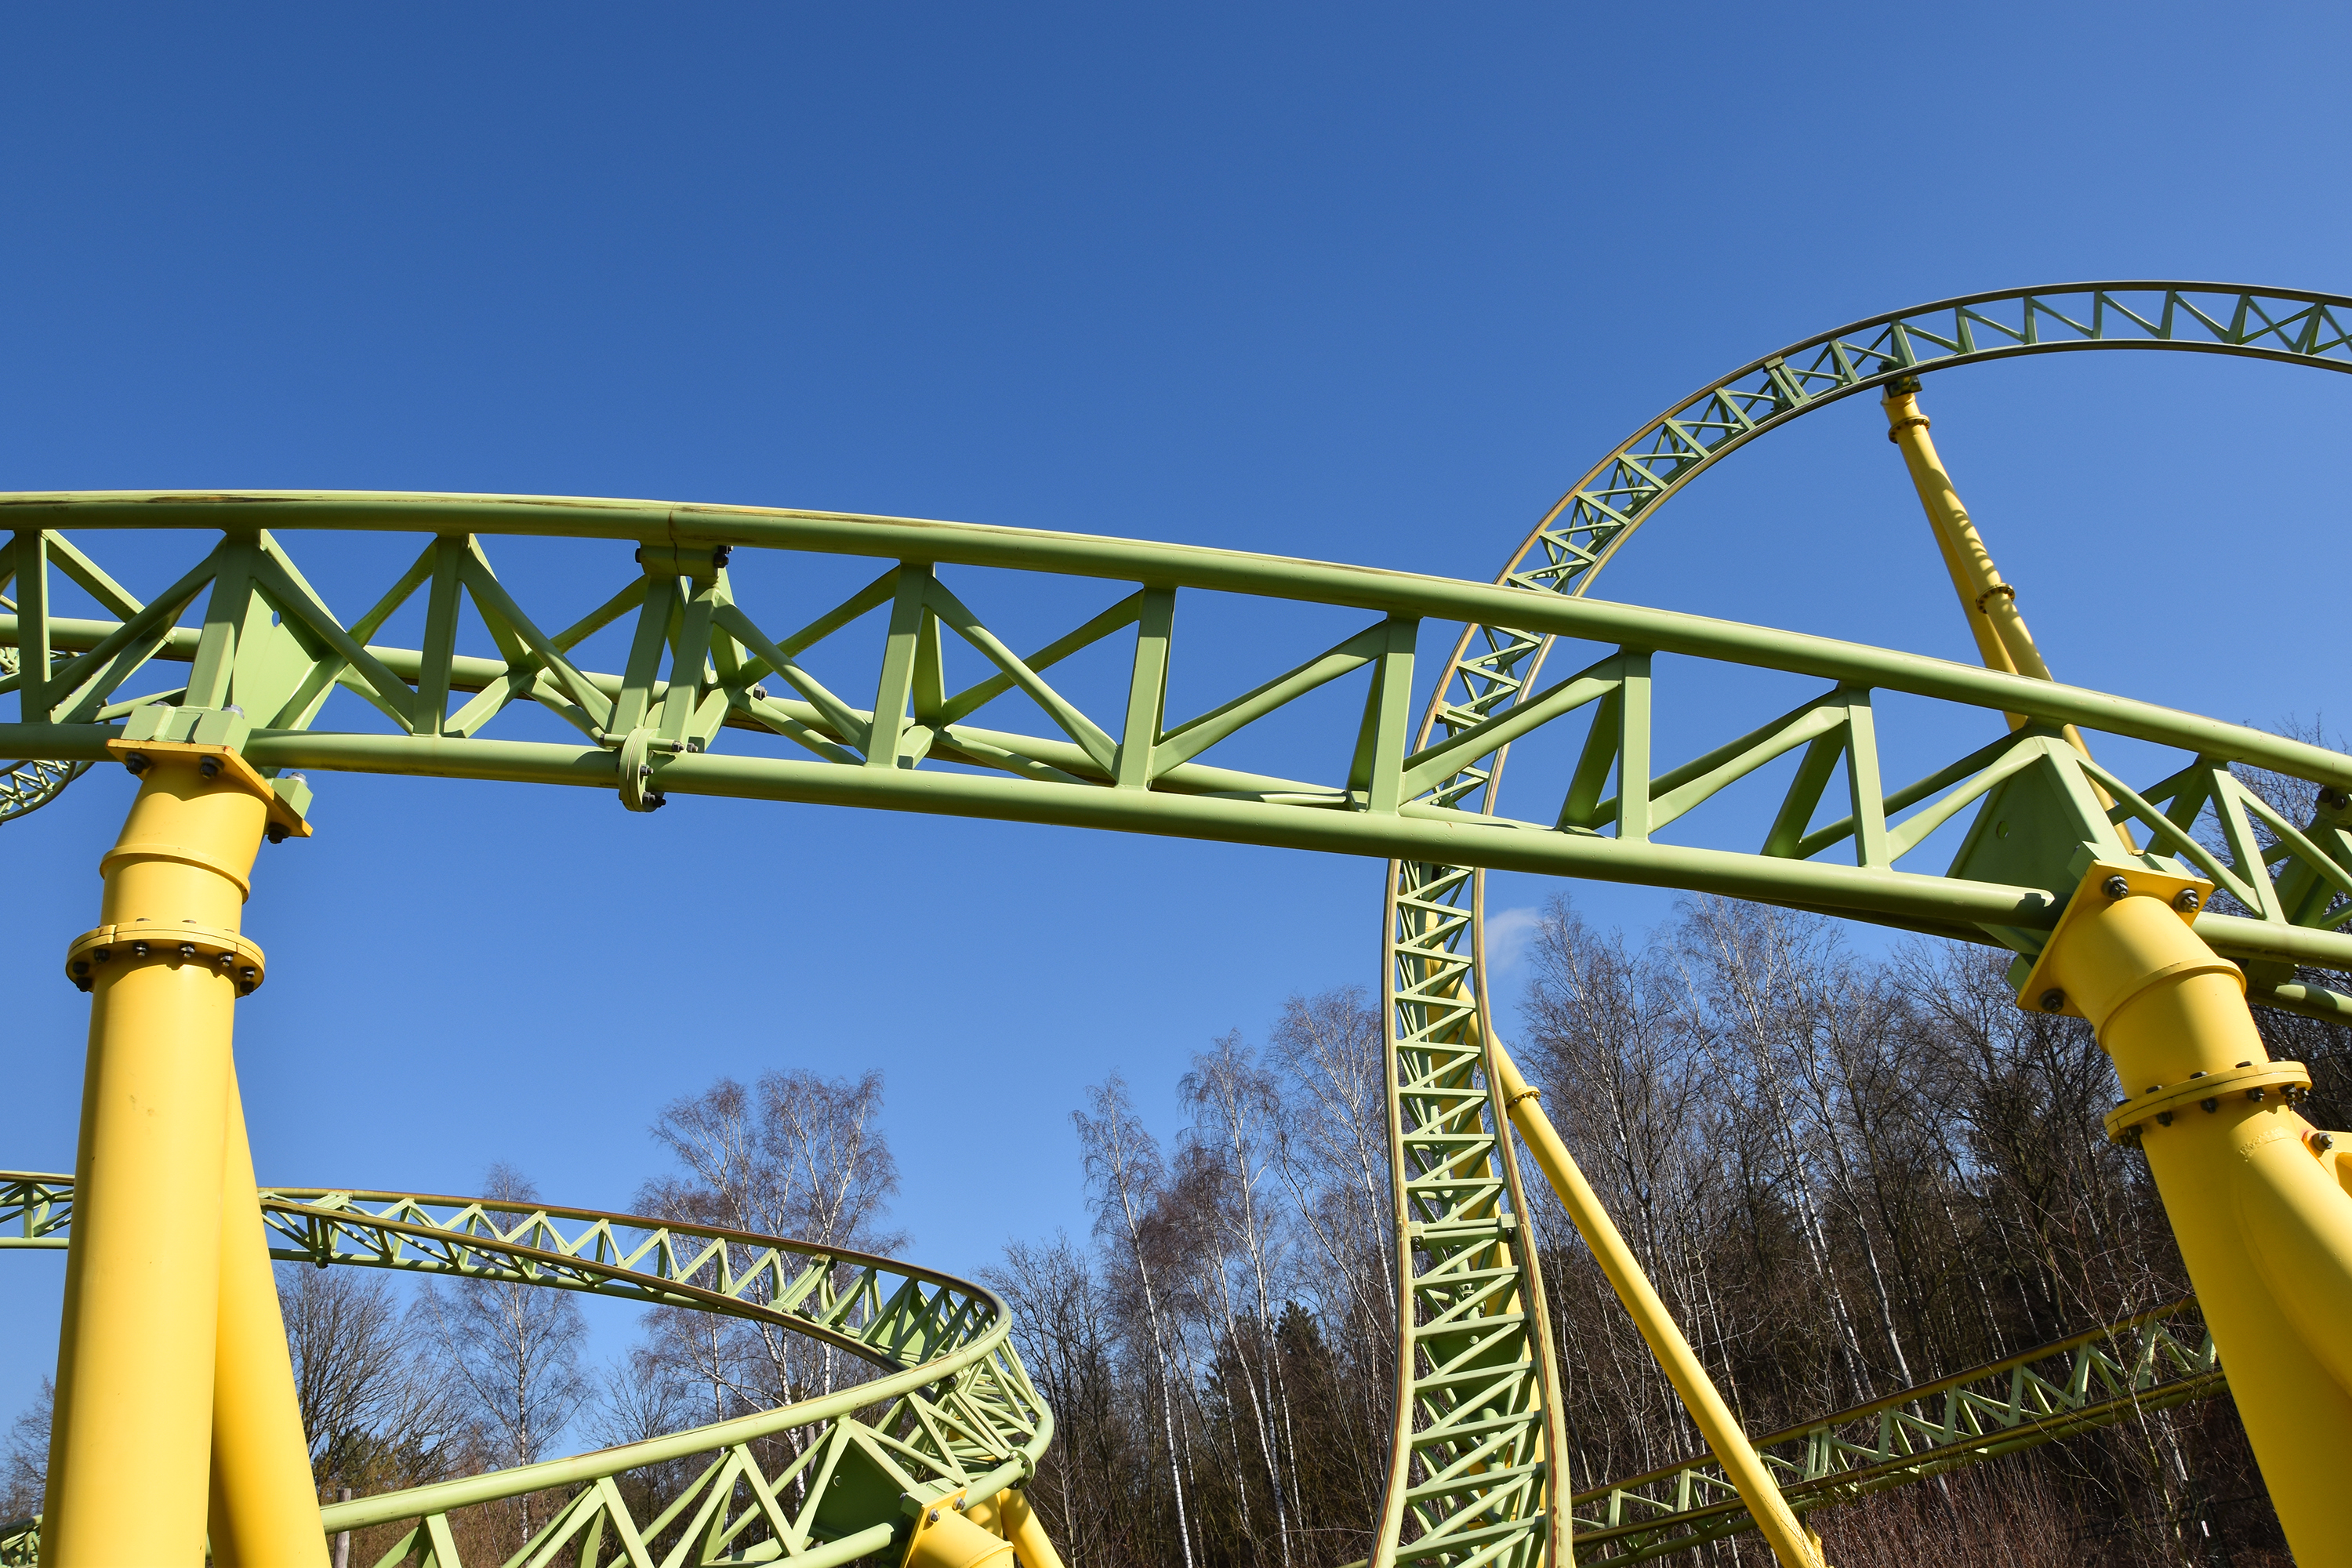
b: Dwervelwind (Theme park Toverland)
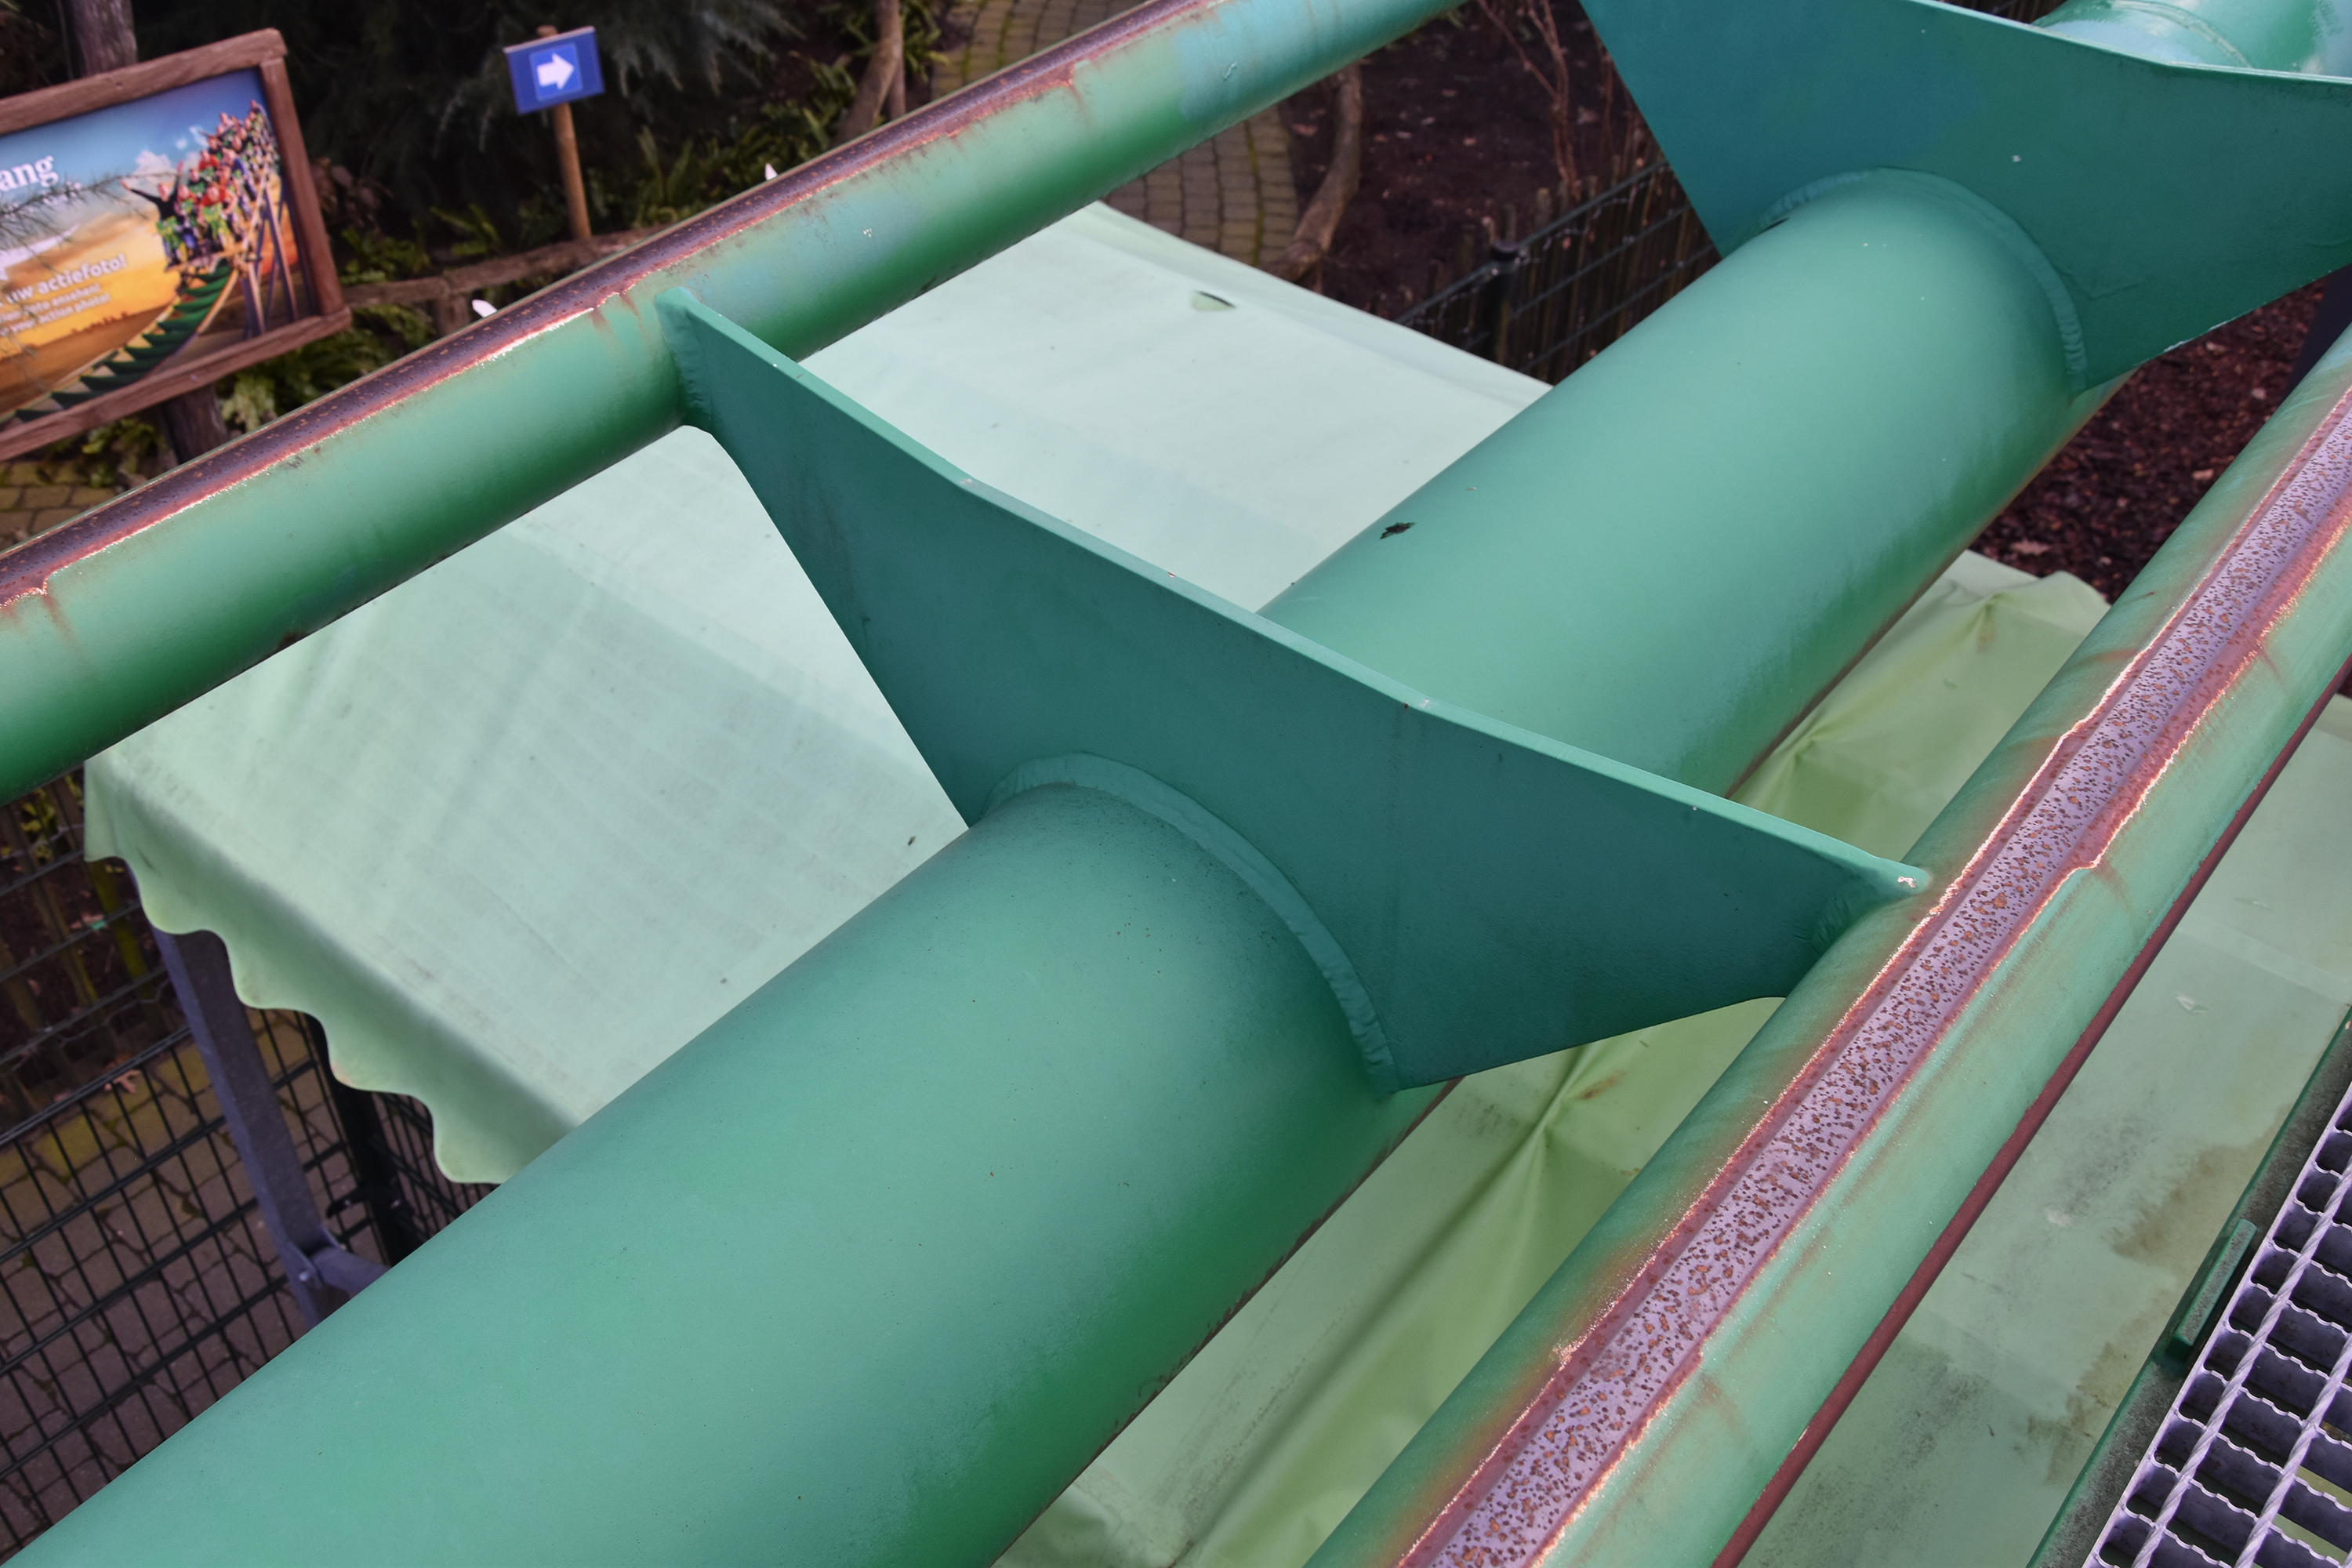
c: Booster Bike (Theme park Toverland)
Figure 1: Investigated roller coasters
The Finite Element model (FE model) used for the optimization is a straight track with a total length of 25 meters divided into five equal spans. In practice, in contrast to the FE model, roller coaster tracks have large curvatures to make turns or inversions. Those curvatures do not cause substantial changes in the stress distribution, which allowed for a straight track model when simplifying the model. The optimization will only be performed for the central span of the structure. The other four spans are present to ensure a realistic structural behavior of the central span since a roller coaster track is never a single span structure.
The loads in the FE model are based on EN 13814-1, which is the European standard for the design and manufacturing of amusement rides. According to this standard, the loads that act on a roller coaster structure are the self-weight and the variable load from a train including passengers. The magnitude of the variable load can vary since roller coasters are specifically designed to expose passengers to accelerations, thereby increasing the variable load. In EN 13814-1, limits are given for the accelerations since the human body cannot handle extreme acceleration. For instance, the maximum acceleration in downward vertical direction is 5G (5 x 9.81 m/s2) for a period of 1.5 seconds. Since roller coaster layouts are mainly designed for accelerations in this direction, this acceleration will be used for the loads in the optimization.
Since the loads on a roller coaster track are dynamic, the structure is only loaded for a few seconds at a time. However, the calculation of a track is a quasi-static calculation for multiple locations of the train. To minimize the calculation time during the optimization, a low number of calculations is preferred. Therefore, it is important to determine the critical locations of the train on the straight track. These critical locations can be determined using influence lines. An influence line describes the internal force, for instance the bending moment, at a specific location in the structure when a unit load travels from the left of the structure to the right, see Figure 2. This principle can also be used for a system of multiple loads, which is the case for a roller coaster train.
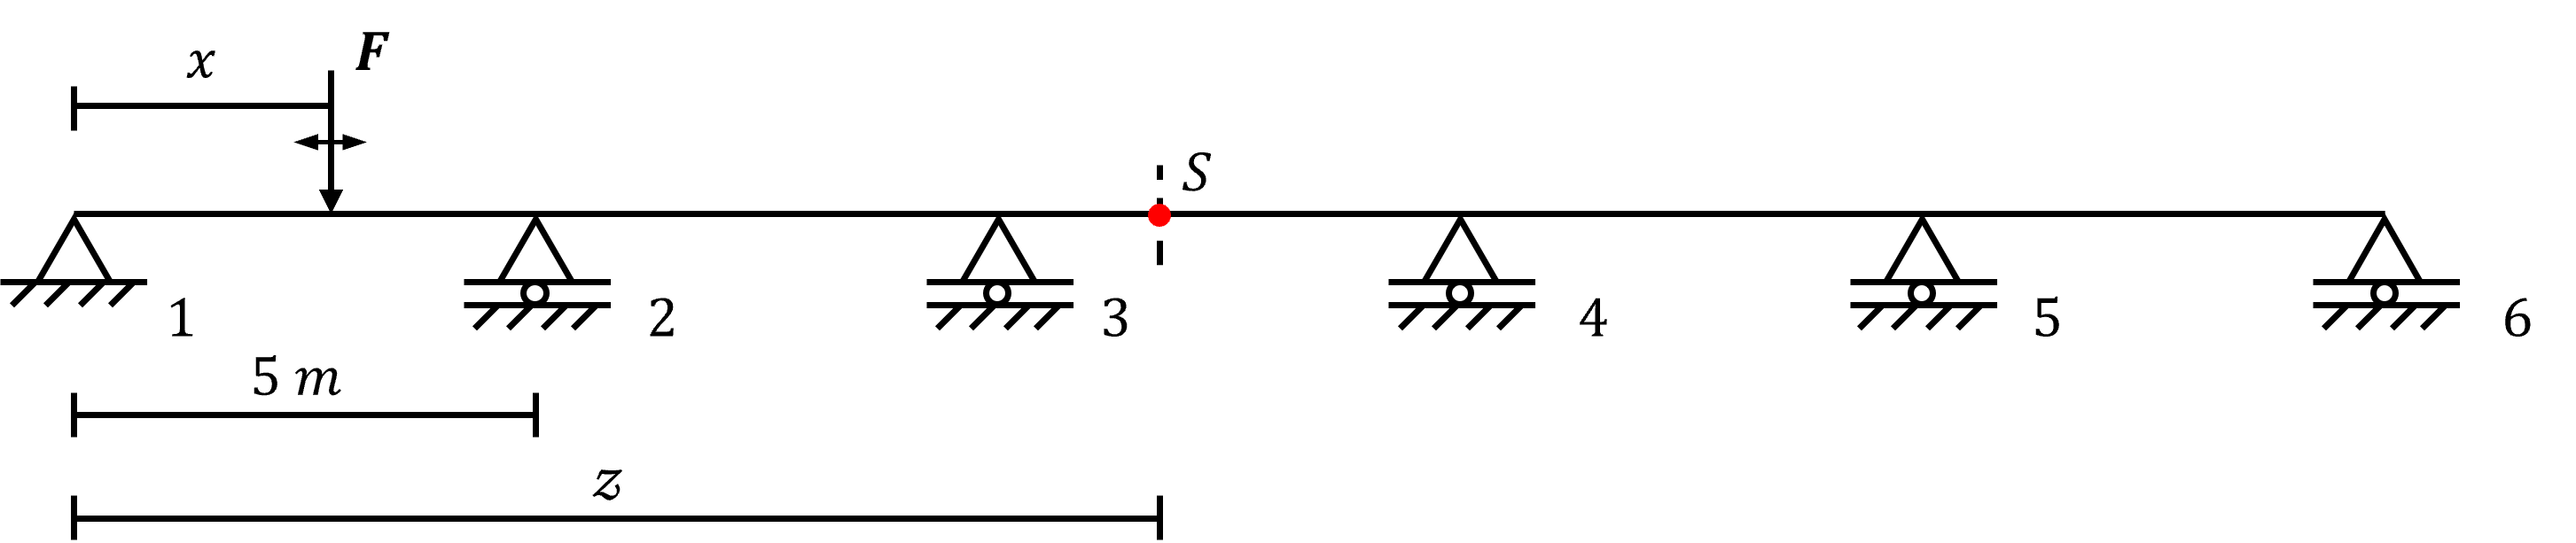
Figure 2: Model of a continuous beam on 6 supports for an influence line
Using these influence lines, the critical positions of the train on the track are determined for the optimization to decrease the number of quasi-static calculations.
An important failure mechanism of periodically loaded steel structures, such as roller coasters, is fatigue. Fatigue failure is caused by microcracks initiated by fluctuating stresses. This type of failure occurs after a number of cycles that corresponds to a certain stress range. The stress range is the difference between the maximum and minimum stress in a cycle. When the stress range is high, the available number of cycles to failure is low. This relation is described by S-N curves in Eurocode 3, part 9. In a first calculation of the Gold Rush track, stress ranges were found that correspond to approximately 800.000 cycles to failure. This number of cycles ensures a life span of around 15 years, which is a realistic time frame for a roller coaster before yearly maintenance will take place. Since the number of available cycles is known, all stress ranges within the model should be lower than the stress range that corresponds to 800.000 cycles. For example, the maximum stress range for 800.000 cycles for individual members is indicated in Figure 3.
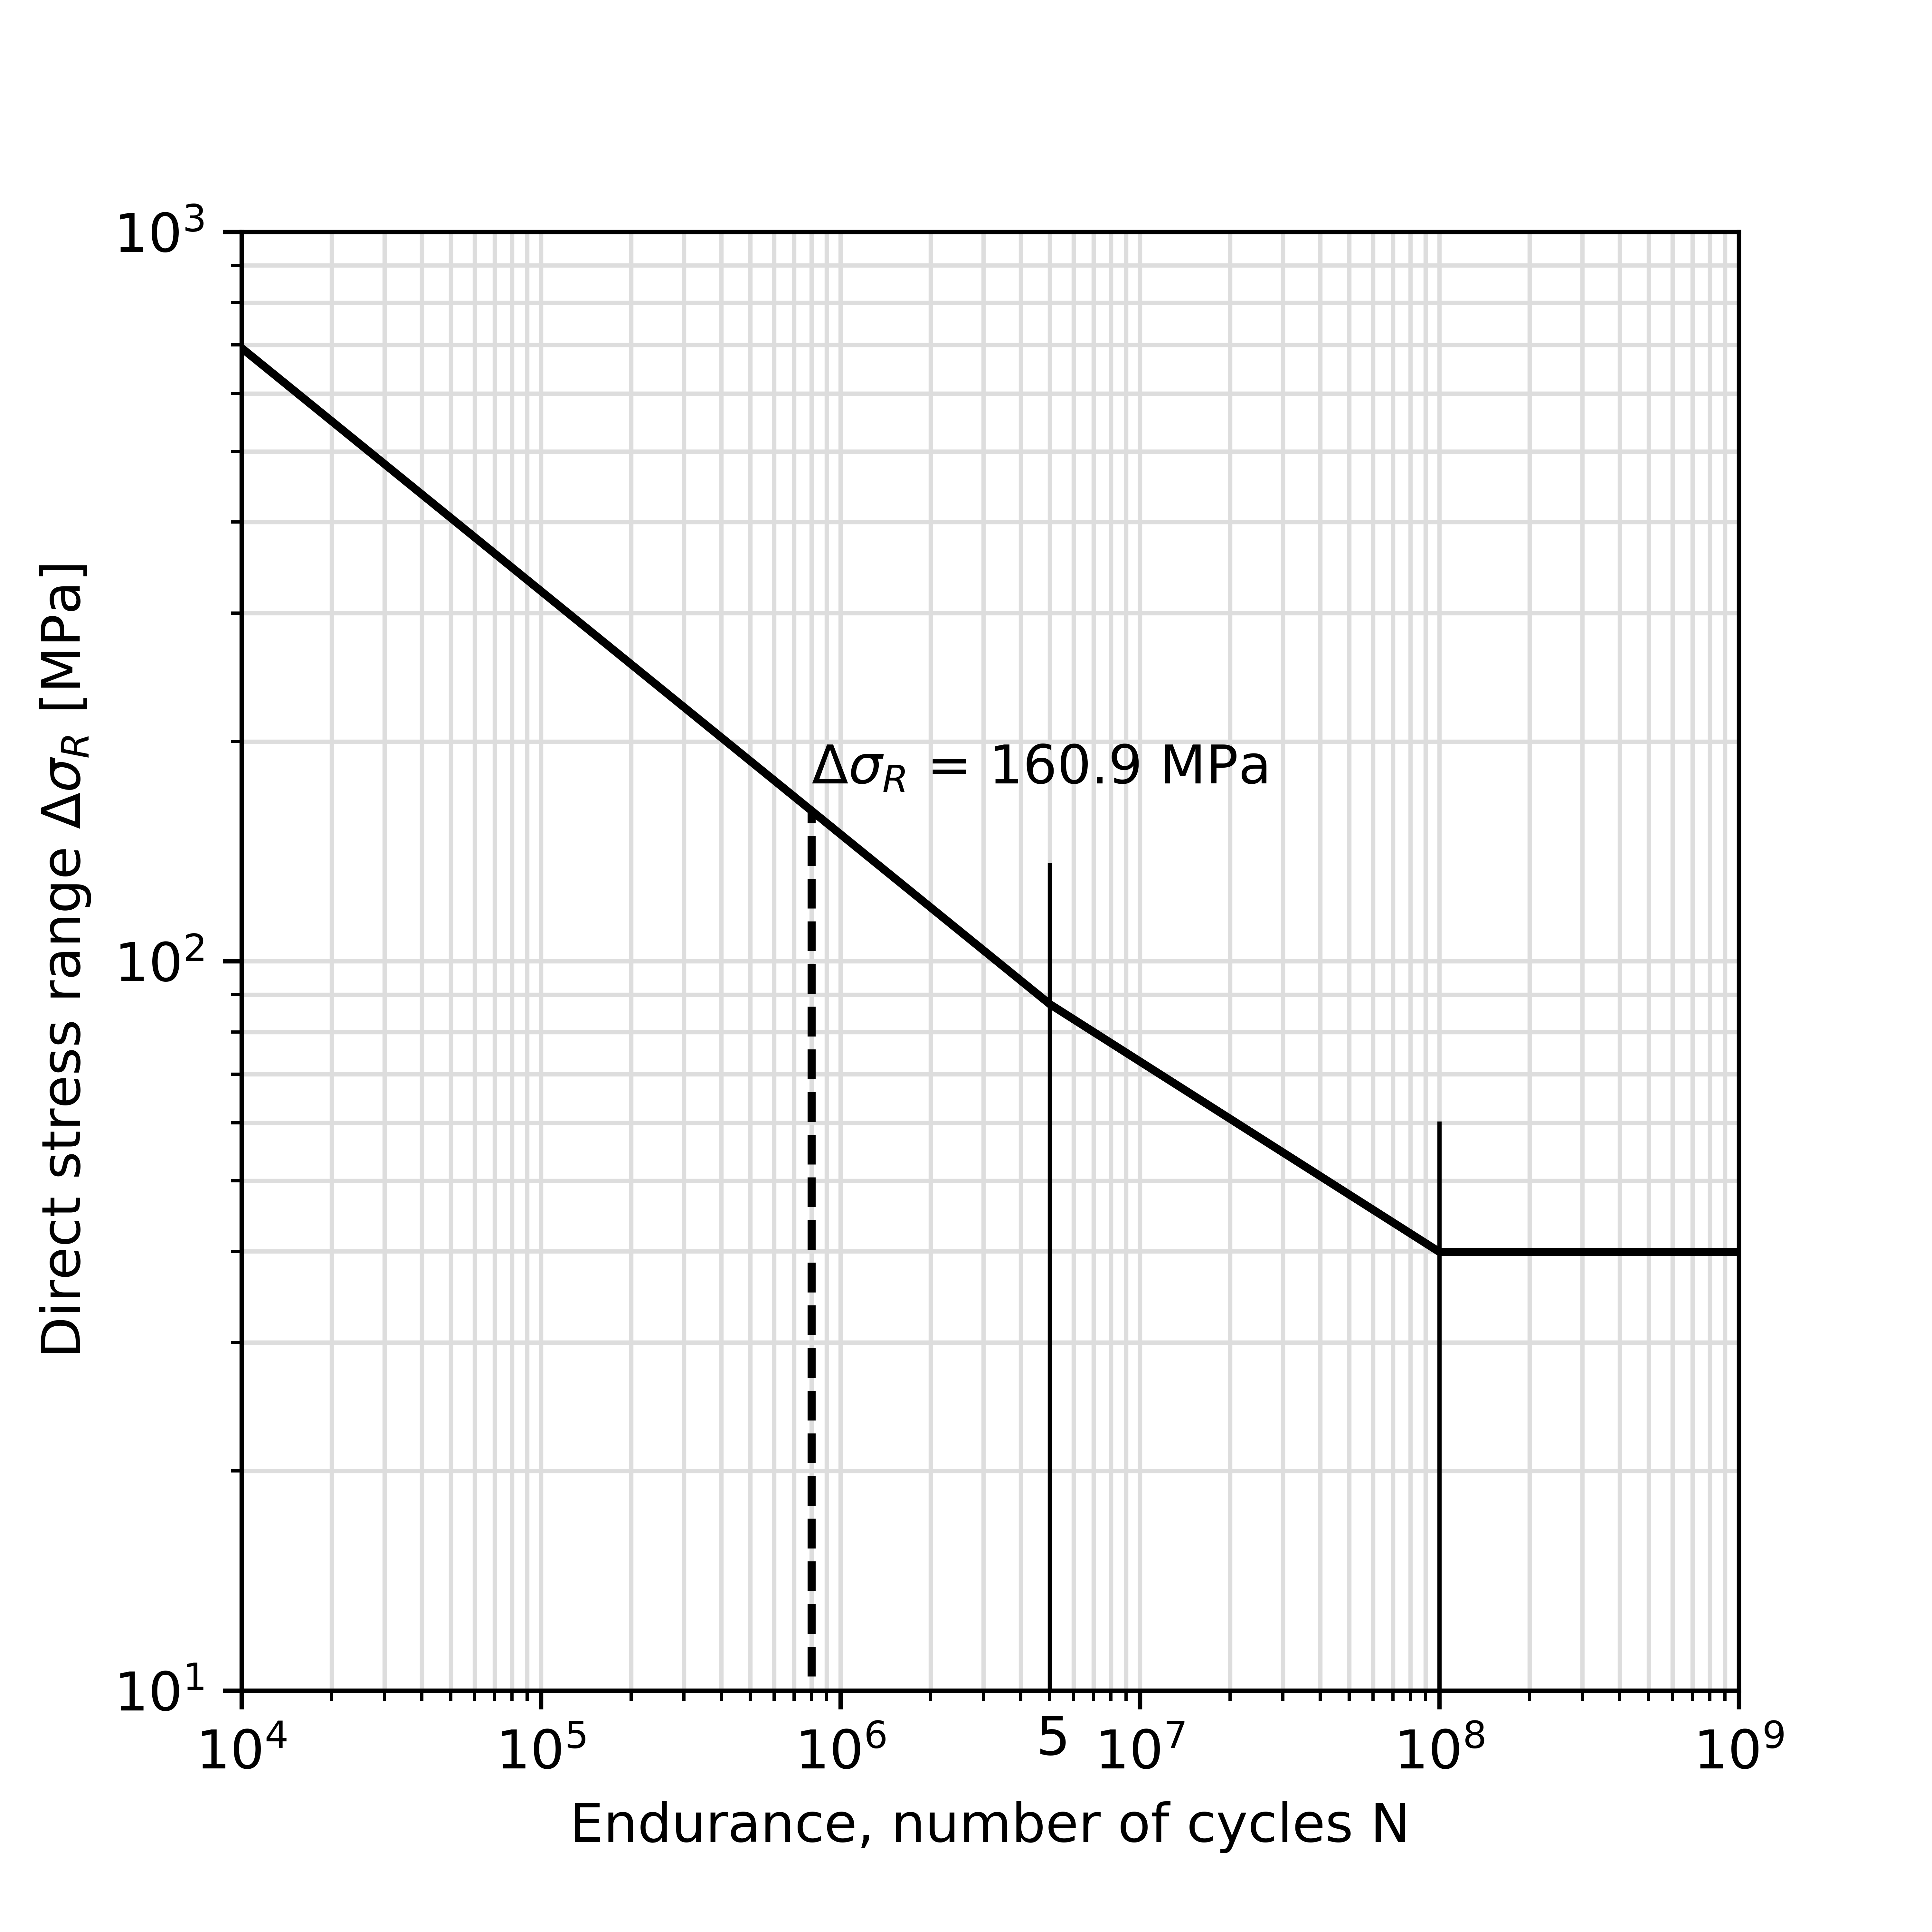
Figure 3: S-N curve for detail category 160, with the maximum stress range for N=800.000 cycles
In the previous paragraphs, the boundary conditions were described for the optimization. Only for the FE models that fulfill these boundary conditions, the final costs will be calculated. To calculate the production costs, a method that is not overly complicated is preferred. The method chosen to calculate the costs is the weld-volume method, which expresses the costs of the used material in €/kg and for the welds in €/cm3, see Equation 1.
€total = €kg,steel ∙ kgtotal + €weldvolume ∙ cm3welds (Equation 1)
The optimization process, which is not yet executed at the moment of writing, will mainly be performed with Grasshopper. The Grasshopper model will be exported automatically to Abaqus. Abaqus then calculates the FE model in the background and exports the results back to Grasshopper automatically. Finally, in Grasshopper, the results will be checked for the boundary conditions, such as the previously described fatigue limits. After the checks, Grasshopper will calculate the production costs. In the end, all the optimized structural designs will be compared, resulting in a track optimized for production costs.